

Hacker Statistic


Table of contents
Overview
Hi guys, In this blog I'll be describing a game and an approach to solve through by simulating the game. This might serve as a basic project for folks new to python or as an interesting problem to solve for a curious fella! :).
prerequisites-basic python,basic statistics and probability,numpy arrays, plotting in matplotlib
Game description
 Suppose You and your friend are about to climb a very tall building and play a game
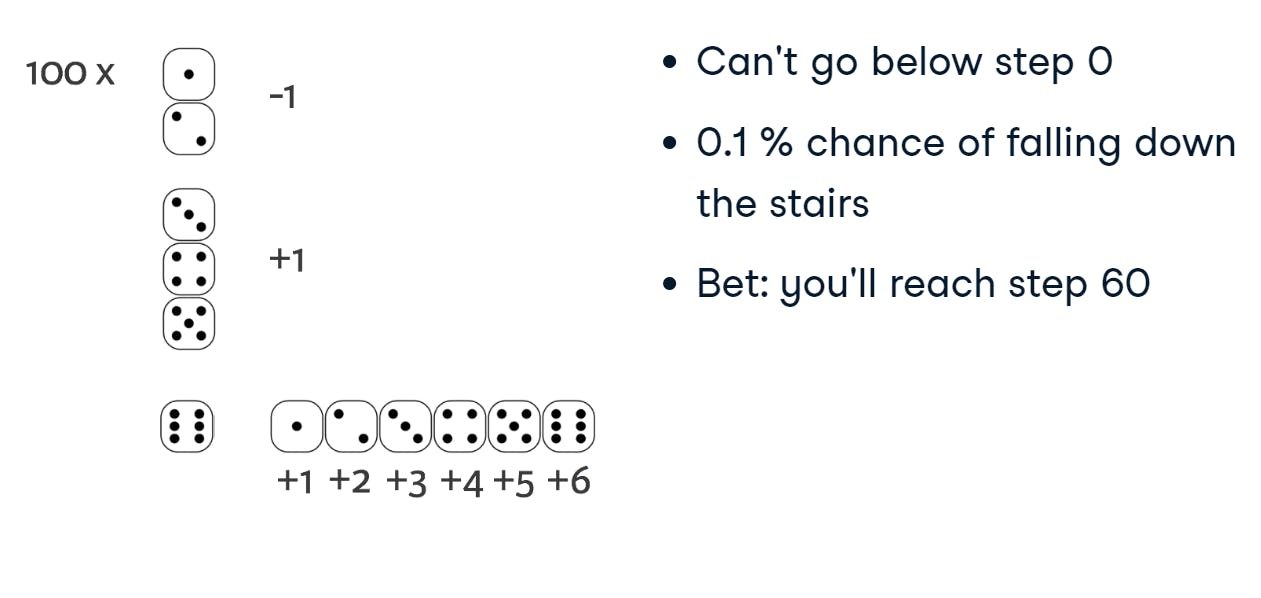
in which you roll a dice 100 times,
Suppose You and your friend are about to climb a very tall building and play a game
in which you roll a dice 100 times,
- if outcome is 1 or 2 you go below 1 step and obviously can't go below step 0.
- if the outcome is 3 or 4 or 5, you go up by 1 step.
- if the outcome is 6, you roll the dice again and climb the number of steps as appeared in dice.
- also you admit that you're a bit clumsy and have a chance of 0.1% of falling down the stairs and when that happens you are required to start again from step 0.
You bet your friend that you'll reach step 60, what is the chance that you win the bet?
So How would you go about solving the problem?
There are two ways to approach it:
- Analytical -solve the problem forming equations.
- Hacker Statistics -simulate the game multiple times and see how many times you reach 60 steps or more and get answer by using formulae: \( n/t \), where n-number of times reached 60 steps or above and t-total no of simulations.
Solution
We would be using numpy for arrays, matplotlib for visualisation and random module, for representing rolling dice in code.
import numpy as np
import matplotlib.pyplot as plt
import random
Now, when we do np.random.rand() or whenever we try to get a random number, computers typically generate a random number using a mathematical formula starting from a random seed, this seed was chosen by python when we called rand() function, but we can also set this manually, this is done to ensure reproducibility as it is random but consistent between runs, so they are actually pseudo random and other people can reproduce your analysis.
for ex- You write the below code to toss a coin, 0-heads, 1-tails and suppose get output as heads, and if a seed has been fixed, when you re-run the script , everytime you'll get same output heads, which can be understood as the heads came randomly first time and now whenever anytime later you run the script this random value is fixed.
import numpy as np
np.random.seed(123)
coin=np.random.randint(0,2)
if coin==0:
      print('heads')
else:
      print('tails')
output:
heads
Here in this code we fixed a seed 123 to ensure reprodicibility, now we'll be generating multiple random walks (when next output depends on previous output, then the path is known as random walk),10000 times and storing them in all_walks.
Here random_walk will store output of all levels when a dice is rolled, we initialize it with step 0.
In each simulation out of 10,000 of them, we roll the dice 100 times and in each roll, we store the current step we are at in step variable, roll a dice and then update step based on conditions of game, also we account for clumsiness, by setting step=0.
np.random.seed(123)
all_walks=[]
for x in range(10000):
    random_walk=[0]
    for i in range(100):
        step=random_walk[-1]
        dice=np.random.randint(1,7)
        if dice<=2:
            step=max(0,step-1)
        elif dice<=5:
            step+=1
        else:
#     when dice outputs 6 then roll a dice again and walk steps upto number on dice
            step+=np.random.randint(1,7)
#     accounting clumsiness
        if np.random.rand()<0.001:
            step=0
        random_walk.append(step)
    all_walks.append(random_walk)
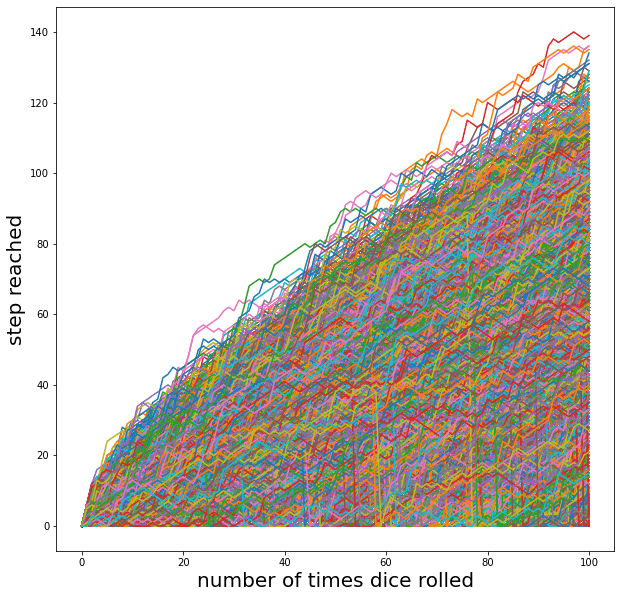
Now we'll visualize all walks, for that we convert all_walks list to numpy array, store it in all_walks_np variable and take transpose of it to store in all_walks_npt variable.
Now when we pass a single argument in plt.plot() then indexes are used on x axis and values in it are used on y-axis.
all_walks_np=np.array(all_walks)
all_walks_npt=np.transpose(all_walks)
plt.figure(figsize=(10,10))
plt.plot(all_walks_npt)
plt.xlabel('number of times dice rolled',fontsize=20)
plt.ylabel('step reached',fontsize=20)
plt.show()
output:
 Okay, We're done with simulations now we need to answer our question, for that we'll need distributions of our final step we reched in each simulation, i.e. the last column of all_walks_np or the last row of all_walks_npt, we store it in
 ends.
ends=all_walks_npt[-1,:]
plt.figure(figsize=(10,10))
plt.hist(ends,edgecolor = "black", color = 'pink')
plt.xlabel('End Steps',fontsize=20)
plt.ylabel('frequency of End steps',fontsize=20)
output:
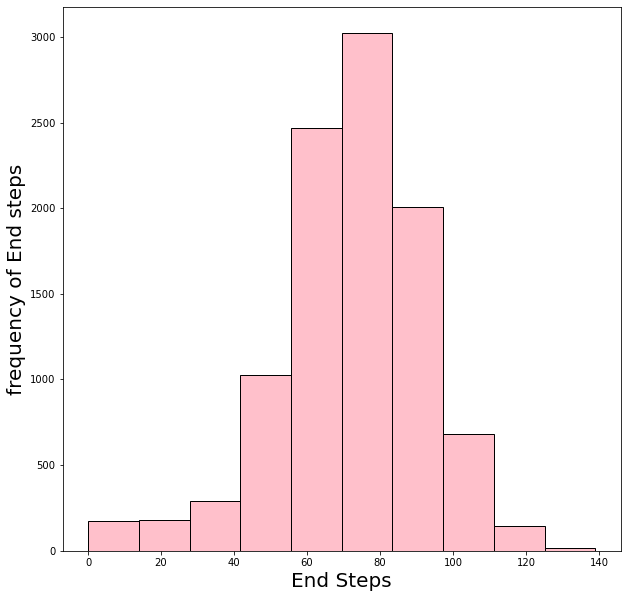 The distribution is close to normal, we can see that we reach a step of 60 in around 2500 simulations out of 10,000.
Now time to get Our solution to the problem.
For that we count number of values that are greater than or equal to 60 in ends and divide by its length (as it's same as number of simulations i.e. 10000)
The distribution is close to normal, we can see that we reach a step of 60 in around 2500 simulations out of 10,000.
Now time to get Our solution to the problem.
For that we count number of values that are greater than or equal to 60 in ends and divide by its length (as it's same as number of simulations i.e. 10000)
greater=ends>=60
answer=greater.sum()/len(greater)
print(answer)
output:
0.7814
Conclusion
We used hacker statistics approach to simulate the game multiple times and used the libraries like random, numpy and matplotlib for the analysis and found 78.14% chances of winning the game.